Python Memory Management
This introductory talk about memory management was presented by me when I was working on IoT mini-hub.
Some terms 😄
- Memory Leak: Memory leak occurs when programmers create a memory in heap and forget to delete it. Memory leaks are particularly serious issues for programs like daemons and servers, which by definition, never terminate.
- Garbage Collection: Garbage Collection is a process of reclaiming the runtime unused memory automatically. Resources other than memory, such as network sockets, database handles, user interaction windows, and file and device descriptors, are not typically handled by garbage collection. Methods used to manage such resources, particularly destructors, may suffice to manage memory as well, leaving no need for GC.
- Manual Garbage collection: Garbage collectors typically do not attempt to optimize the use of resources other than memory. If you only want throughput then you don’t need to do manual garbage collection, but if you have resource constraint then you need to do it to use your resources in an optimized manner.
Run time memory 😊
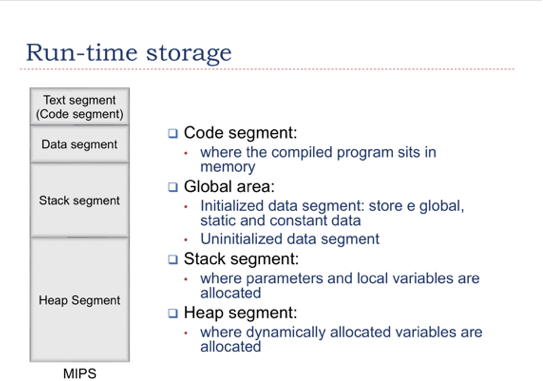
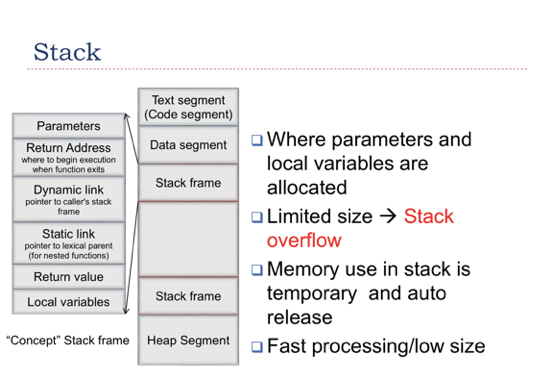
How Program manage runtime memory Stack vs Heap?

Pic 1.1: Run time storage

Pic 1.2: Stack

Pic 1.3: Heap
Memory leak example
void Fa() {
}

void Fb() {}

void Leak() {
// Leak !
int *a = new int[10]; Fa();
Fb();
return;
}
void main() {
Leak(); }Solution
...
delete a[]; return;
A Python example
def foo(a=[]):
    a.append(time.time())
    return a
Memory Allocator
How Python allocates memory?

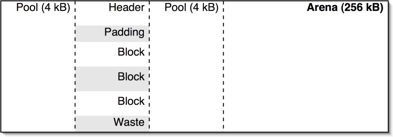
Pic 1.4: Pymalloc allocator
Pymalloc is a Python memory allocator, which was written by Vladimir Marangozov. It was introduced with Python 2.1 and become the default with 2.3
Python Use lots of small objects that get created and destroyed frequently
To avoid multiple malloc() and free() call for these purposes, python uses 256KB memory chunk called arena, divided by the 4KB pool
#### Lets see how memory gets allocated and freed by python

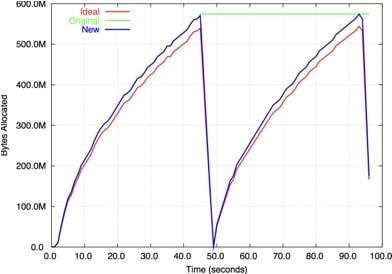
Pic 1.5: Memory pool example
- Check if any pool already been divided into the block of required size. Each Pool is a singly linked list of each block
- If we found such pool we pop a block off of the list and return back to the application
- If there is no such pool available we will find from free pools linked list, if there is pool available we will pop it off else we create a new pool
- Similarly, if last memory is full we will pop off arena base pointer if there is no space we will use malloc() and create new space
- Similarly for freeing memory similar procedure happened and then allocator put that pool to the free pool list
Enough of technical, probably boring points, lets understand this in a layman’s term. Assume you are organising a play party and have invited some groups of children from different places to participate. Following are some rules - - Different children groups can come at different times and will return to their place after getting enough play time with toys - Toys are organised into some collections with fixed number of toys - You can’t order a single toy or a single collection from vendor, but you have to order a group of toy collections only
Since you wanted to optimise order (Assuming you are renting toys from a vendor shop near your place on hourly basis) you are not going to order all toys at once and keep them with you, you decided following strategy
- You have already rented a collection by your own earlier estimates
- When a new group of children will come, you will count number of children in that group
- Now you will check in your collection, whether you can meet requirements for the children
- If you have enough total toys in your collection, you will give the toys to those children
- If you were not able to meet requirements from your own collection then you will try to pick a new collection and distribute from that
- If you are running out of toy collection also then, you will have to rent some more order from vendor
Now replace item this scenario with following - Children with process or program - Toy with memory bit - Toy collection with memory chunks - Order with memory pool - Vendor with OS - Yourself with memory allocator
If you able to visualise these, congrats you understood how memory allocator works 🎉
Benefit and disadvantage of this
- Since this procedure requires less memory, read and write it is much faster
- There is no code to match free pools with the areas they belong to, and then to return free arenas to the operating system
- To do this, a free pool needs to be put on a list specifically for the arena that it comes from. Once all the pools in the arena are on that list, the entire arena can be released
- To solve this problem partially allocated arenas are created so that we can utilize memory as much as possible and not create much more arenas
Example
iterations = 2000000
l = []
for i in xrange( iterations ):
        l.append( None )
for i in xrange( iterations ):
        l[i] = {}
for i in xrange( iterations ):
        l[i] = None
for i in xrange( iterations ):
        l[i] = {}
Memory usage by Python
How much python use memory for different data type?
- Unlike ‘C’, Python doesn’t specify data type before assigning value to object. Thus, different data objects behave differently with python
- On different systems (32 Bit, 64 Bit, Linux, Windows) python use different Byte data for the same object
Debug Memory usage
How to profile and check Memory usage by your script?
- Form of dynamic program analysis to measure usage of resources by the program to optimize our program (e.g. memory profiling for memory usage analysis)
- Profilers use a wide variety of techniques to collect data, including hardware interrupts code instrumentation, instruction set simulation, operating system hooks, and performance counters. Profilers are used in the performance engineering process.
Program analysis tools are extremely important for understanding program behavior. Computer architects need such tools to evaluate how well programs will perform on new architectures. Software writers need tools to analyze their programs and identify critical sections of code. Compiler writers often use such tools to find out how well their instruction scheduling or branch prediction algorithm is performing…
Some tool to debug
- Memory_profiler: https://pypi.python.org/pypi/memory_profiler
- pympler: https://pythonhosted.org/Pympler/muppy.html
- Vprof: https://pypi.python.org/pypi/vprof/
Best Practice
- Create less objects (useless temp object)
- Use generators (and/or use files)
- Split your code into smaller modules
- Import necessary functions only from another module
- Run profiling tools over your script before creating service
- Find the number of the objects your script is using and optimize it
- Use common object for the same purpose like config
- Minimize your code before making a package for low memory requirement system
